Probabilities and Percentiles: A 3-Part Series
Machine learning is mainstream in our products and an excellent way to deliver predictive, real-time insights. In some cases, however, the terminology used by data scientists might be unfamiliar to key decision makers. Read on to learn more in our 3-part series on Probabilities & Percentiles.
Two of the most common ways to talk about the predictions from a machine learning model are the probability predicted by the model and the percentile of the prediction across the population evaluated by the model. It gets even more confusing since probabilities are often expressed as percentages. In this blog series, we will discuss what each of these outputs tell you and how to use them to solve problems for your business.
Part 1 – Probabilities
This is the first of three articles, where we get into what a probability represents. If you’re more interested in learning about quantiles, read Part 2. If you’re ready for the highlights on how probabilities and quantiles are different and when you should use each one, read Part 3.
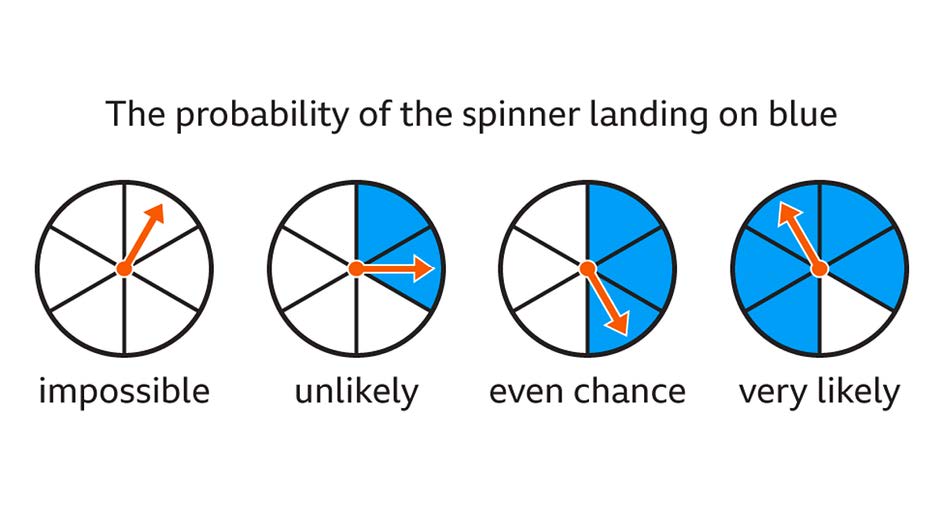
By default, machine learning models often return a probability. A probability reflects the model’s prediction of how likely a record is to belong to a given group. The range of a probability is 0 to 1, including both 0 and 1, where 0 means something is impossible and 1 means that something will happen with certainty.
For example, we might train a model that tells us given the details we have about a customer, how likely are they to buy our product. If the customer buying or not buying our product was equally likely, the probability of both outcomes would be 1/2, or 0.5 (50%). If the customer was more likely to buy our product than not buy our product, the probability would be greater than 0.5, and conversely if they were more likely to not buy than to buy, the probability would be less than 0.5.
To continue reading Part 1, click here.
Part 2 – Percentiles (Quantiles)
This is the second of three articles, where we get into what quantiles, deciles, and percentiles are. To read about probabilities, check out Part 1. To read about how probabilities and quantiles are different, and when each is useful, read Part 3.
Quantiles are a way of dividing up a group of data into equal sized and adjacent groups. Equally sized is pretty straight forward to understand; if you have a group of 100 items, and you want to sub-divide that group into five groups (quintiles), each of the sub-groups would be 20 items.
If you have had children (or have been a child) in the United States, you might be familiar with the growth chart percentiles published by the Center for Disease Control (CDC).
To continue reading Part 2, click here.
Part 3 – Probabilities and Quantiles: How They’re Different, and Why it Matters
This is the third of three articles, where we highlight the differences between probabilities and percentiles, and discuss when each output is most useful. For an introduction to probabilities, check out Part 1. For an introduction to quantiles, including deciles and percentiles, read Part 2.
To quickly recap our previous two posts in the series, the probabilities generated by a predictive model can be useful for understanding how likely an individual record is to belong to one outcome or another (e.g., person x has a 0.2 percent probability of buying product y). However, without knowing what the overall population looks like they are not helpful for making statements on where an individual record falls relative to the population of records.
Quantiles like deciles and percentiles are helpful for contextualizing an individual probability within the population of probabilities that are likely given a certain problem. They are the ranked groups a population can be divided up into. Knowing something is in the 20th percentile means that 20% of values in the population are less than that value, and 80% are greater. It doesn’t necessarily say anything about the individual’s probability, but it lets us compare it to the population at large.


